Environmental Management
Goal and Performance Highlights
| Strategic Targets | Target Achievement | 2025 Performance (%) |
2025 Goal | 2026 Goal1) | 2034 Goal |
|---|---|---|---|---|---|
| Greenhouse Gas Emissions | |||||
| Scope 1 and 2 compared with 2019 | Reduced by 45% | Reduced by 22% | - | - | |
| Scope 3 compared with 2019 | Reduced by 15% | Reduced by 22% | - | - | |
| Scope 1, 2, and 3 compared with 2019 | Reduced by 24.6% | Reduced by 22% | - | - | |
| Scope 1, 2, and 3 compared with 2024 | Reduced by 7.7% | Reduced by 5% | Reduced by 10% compared with the 2024 base year* | Reduced by 46.2% compared with the 2024 base year | |
| Electricity Consumption | |||||
| Grid electricity consumption under the Company's control (controllable portion) | Reduced by 1.3% compared with the previous year, 2024 | Reduced by 5% compared with the previous year, 2024 | Reduced by 5% compared with the previous year, 2025 | - | |
| Grid electricity consumption under the Company's control (controllable portion) (Like-for-Like) | Reduced by 3.6% compared with the previous year, 2024 | Reduced by 5% compared with the previous year, 2024 | Reduced by 5% compared with the previous year, 2025 | - | |
| Electricity consumption intensity per unit area under the Company's control (controllable portion) compared with 2015 | Reduced by 25% | Reduced by 20% | - | - | |
| Renewable Electricity Consumption | |||||
| Share of renewable electricity consumption compared with total building electricity consumption | 3.62% | ≥ 4.5% | ≥ 6.5% | ≥ 10% | |
| Share of renewable electricity consumption compared with total building electricity consumption (shopping centers only) | 4.2% | ≥ 4.5% | ≥ 6.5% | ≥ 10% | |
| Renewable energy use across all shopping centers, both in Thailand and overseas | 70 (31/44) |
≥ 60% | - | 100% | |
| Water Withdrawal | |||||
| Water withdrawal | Increased by 1.85% compared with the previous year, 2024 | Reduced by 5% compared with the previous year, 2024 | Reduced by 5% compared with the previous year, 2025 | - | |
| Water withdrawal (Like-for-Like) | Reduced by 4.6% compared with the previous year, 2024 | Reduced by 5% compared with the previous year, 2024 | Reduced by 5% compared with the previous year, 2025 | - | |
| Water reuse ratio compared with total water withdrawal | 3.1% | 5% | - | 10% | |
| Wastewater quality2 | 100% Water quality indicators complied with Ministry's announcement | No legal disputes related to wastewater discharge into public water sources | No legal disputes related to wastewater discharge into public water sources | No legal disputes related to wastewater discharge into public water sources | |
| Waste Management | |||||
| Waste recycled and recovered for beneficial use | 54.5% | 60% | 65% | 80% | |
| Sustainable Buildings | |||||
| Share of area certified under the GRESB definition compared with total area | 7.2% | 7% | 10% | 20% | |
Remarks:
1) The base year was adjusted to 2024 because this was the period when business operations returned to normal after COVID-19 and appropriately reflects the expansion of the Company's project portfolio.
2) The quality indicators measured include Biochemical Oxygen Demand (BOD), Total Suspended Solids (TSS), Total Dissolved Solids (TDS), acidity and alkalinity (pH), and Oil and Grease.
| System-Level Targets and Legal Compliance | Target Achievement | Performance | Target |
|---|---|---|---|
| Standard Coverage Operating areas certified to ISO 14001 as a percentage of total area |
75.3 | 75 | |
| Legal Compliance Full legal compliance record |
No disputes and no significant environmental fines | No disputes and no significant environmental fines | |
| Effectiveness of the Grievance Mechanism | Received 18 environmental complaints from communities and successfully remediated, mitigated impacts, and closed 100% of complaint cases. | Successfully remediated and closed 100% of environmental complaint cases from communities. |
Target Achievement
Challenges and Opportunities
The real estate business faces systemic environmental challenges, including physical climate risks and transition risks. Financial risks from resource management are also key factors that directly affect the Company, particularly operating expenses (OPEX). Utility costs, including electricity, water, and gas, account for up to 20% of total operating costs, with electricity representing 90% of utility consumption in business operations.
Central Pattana sees an opportunity to turn these challenges into a competitive advantage. Systematic environmental management not only reduces risks, but also improves operational efficiency, attracts green investment, and builds confidence among all stakeholder groups. Effective resource management and a higher proportion of renewable energy are important mechanisms for reducing the severity of climate risks and lowering business costs. The Company therefore seeks high-performance technologies and innovations to reduce operating costs while lowering greenhouse gas emissions in both the short and long term, supporting our goal of achieving net zero greenhouse gas emissions by 2050.
Management Approach and Value Creation
Board Level Governance Structure
To ensure environmental management is transparent and auditable from the highest level, the Company has taken steps to improve the charter and responsibilities of the board. Concretely as follows:
- Clearer roles and responsibilities: The Company has improved the charters of the Board of Directors, the Corporate Governance and Sustainable Development Committee, and the Risk Management Committee to clearly define their roles in overseeing climate-related risks and opportunities.
- Expanding the scope of oversight: The Company has expanded the responsibilities of the Corporate Governance and Sustainable Development Committee, the Climate and Environment Committee, and the Occupational Health, Safety, and Working Environment Committee to cover climate-related risks and opportunities across all business groups, including shopping centers, offices, hotels, residences, and building management under CPNREIT.

Board Level Governance Structure
Strategic Operating Framework and Management System
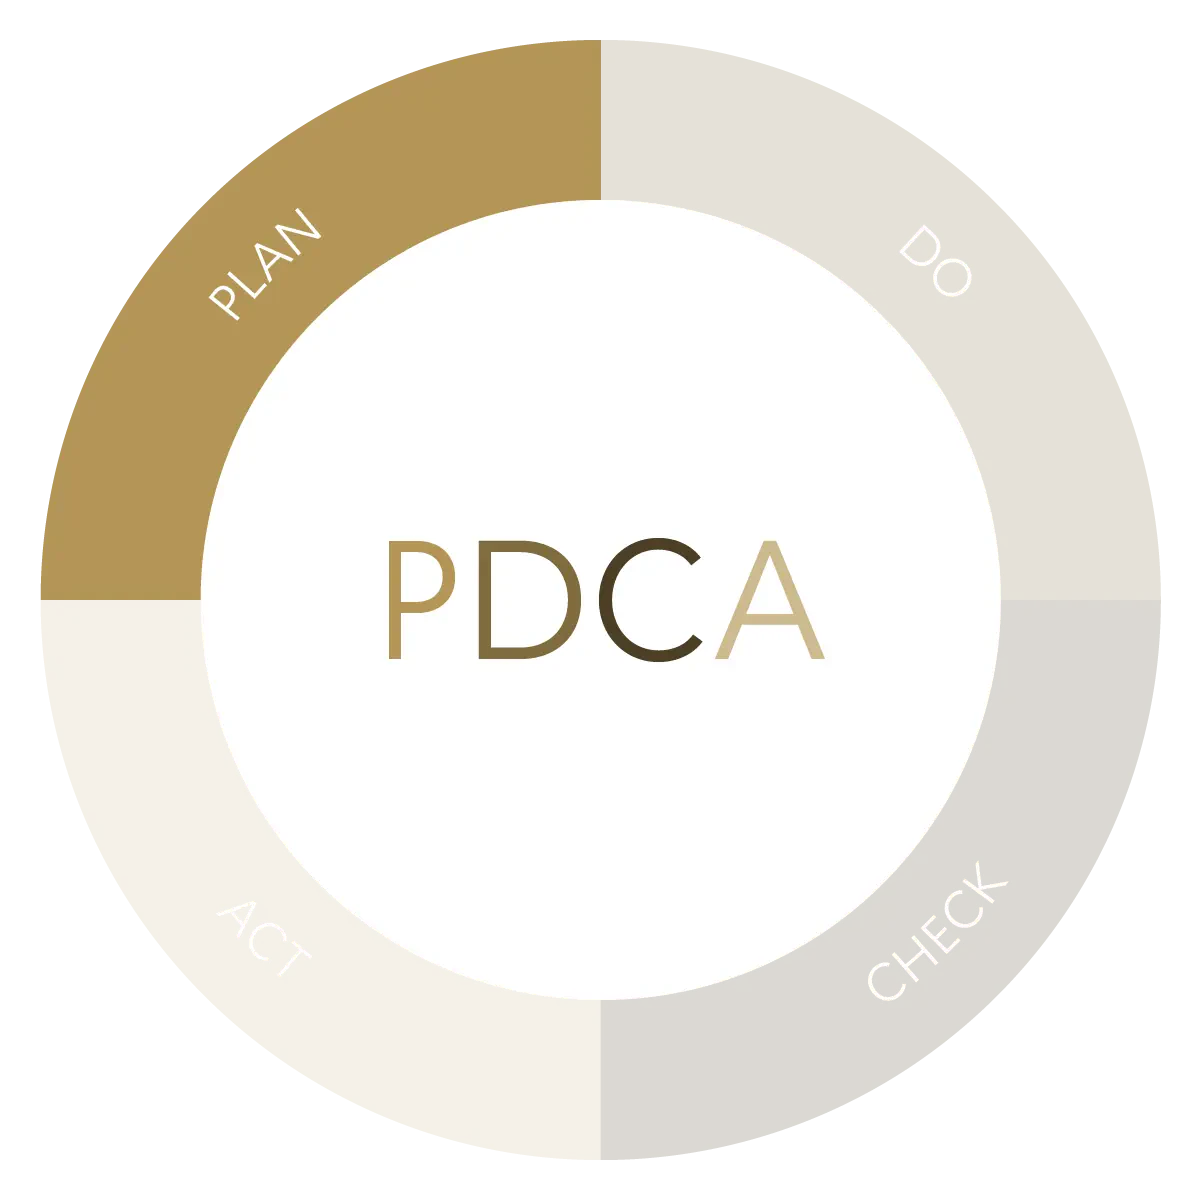
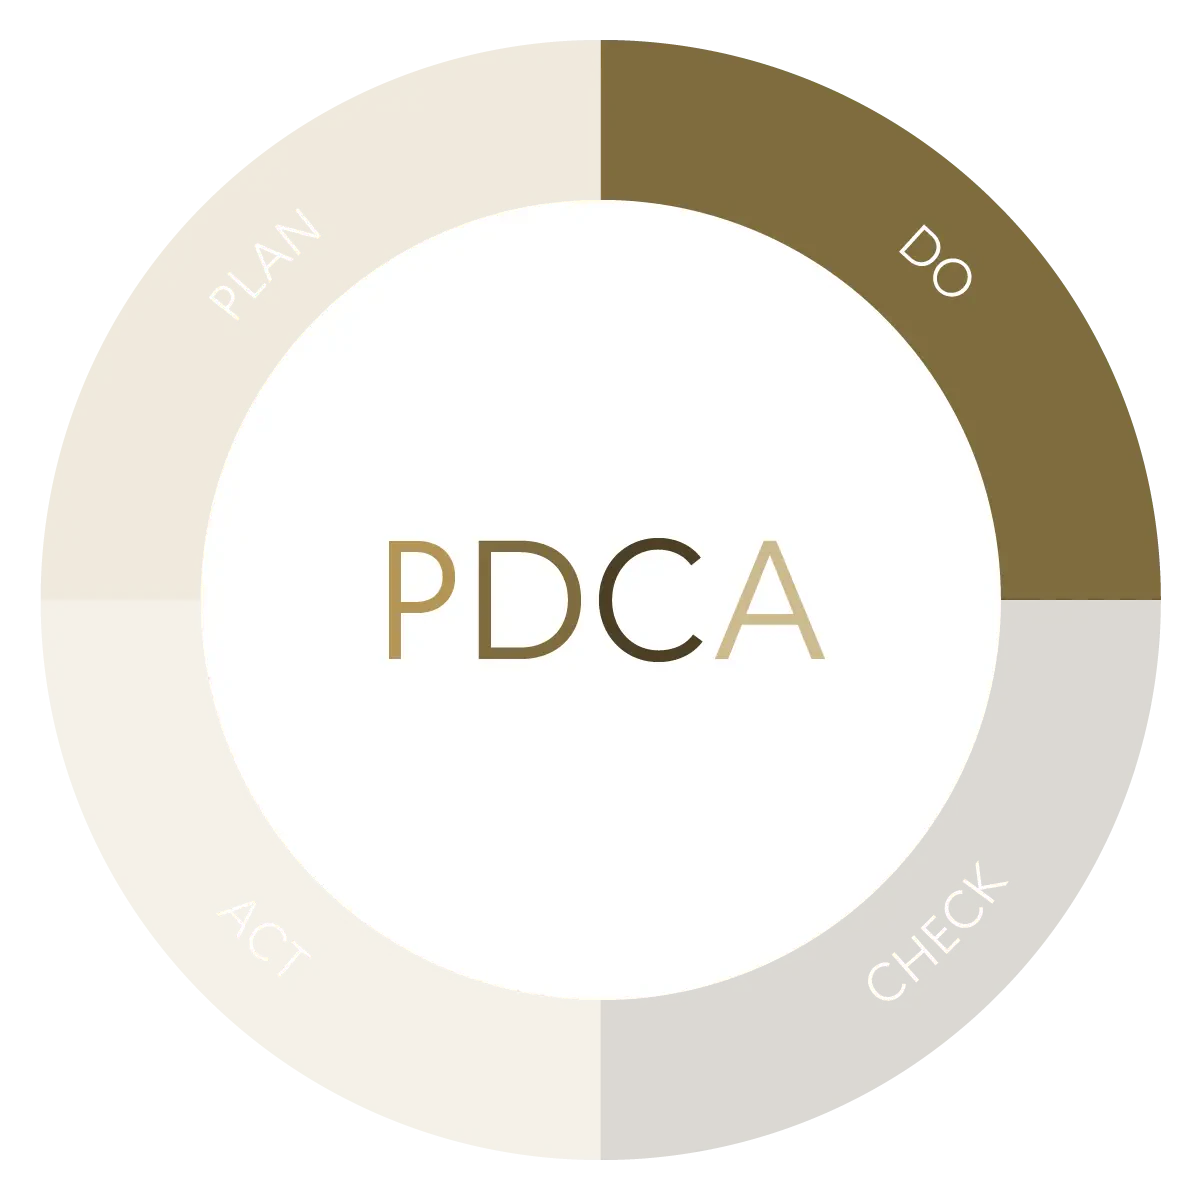
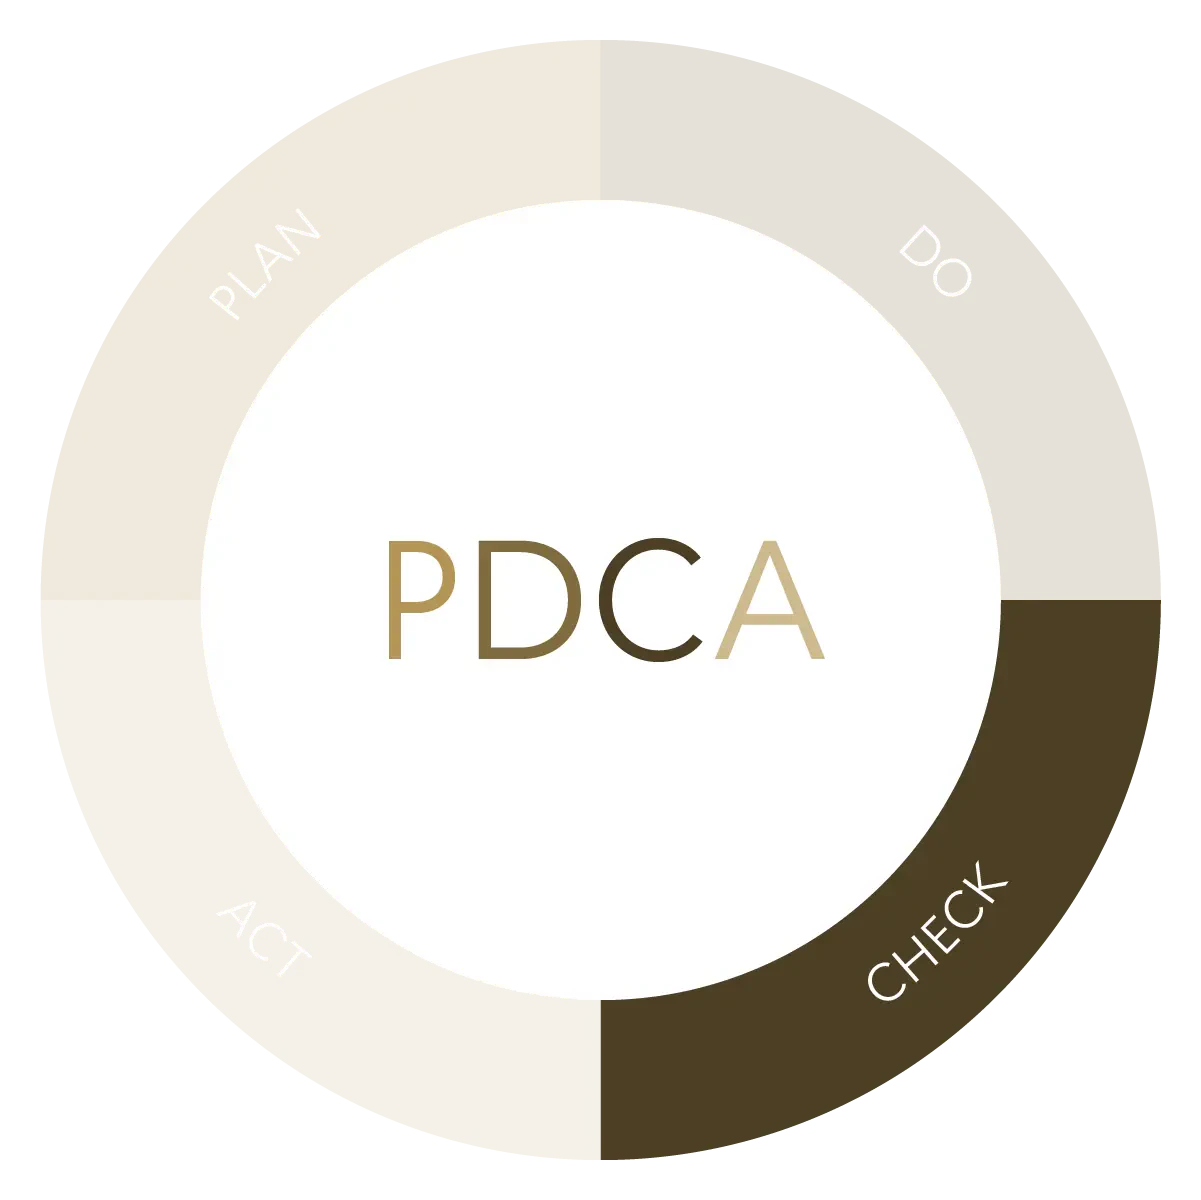
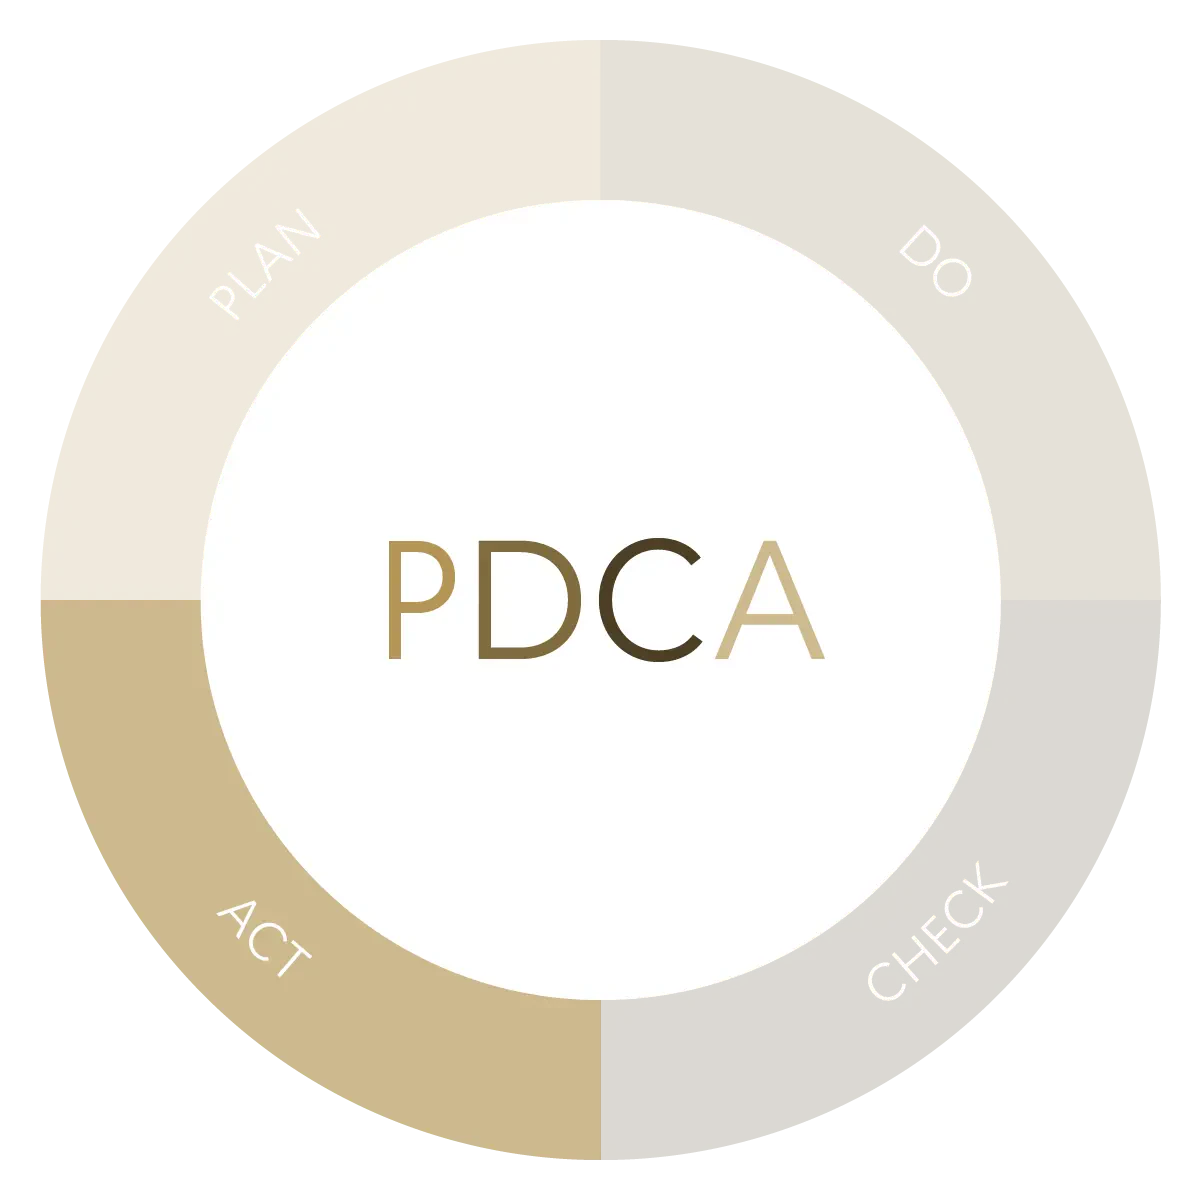
The Company conducts business in accordance with climate and environmental policies. Using an environmental management system aligned with the international standard ISO 14001. The system is driven by the PDCA (Plan-Do-Check-Act) quality cycle as the core of governance mechanism to prevent negative impacts and strictly comply with applicable laws. The operational framework is classified into 4 strategic categories and reports under 8 subtopics as follows

Strategic Operating Framework and Management System
| Strategic Categories | Reporting and Quantitative Performance Results |
|---|---|
| E1: Greenhouse Gas Reduction | Climate Mitigation |
| Energy Management | |
| Green Building | |
| E2: Climate Adaptation | Climate Adaptation |
| Air Quality Management | |
| E3: Circular Economy | Waste Management and Circular Economy |
| E4: Maintaining Resources and Biological Diversity | Water and Wastewater Management |
| Ecology and Biodiversity |
Environmental Policy in Action: The Pillars of Sustainable Management